Better Automation for File Transfer with WinSCP
Want to create your own automation scripts for file transfer? With a few tips, you can get better automatin with an FTP client like WinSCP Read More
Published on 06 Oct 2014
by Tom Fite, Engineering Manager at ExaVault
We here at ExaVault are obsessed with making sure that our customers get the best transfer speed possible. You paid good money for that 50 megabit connection, so we better make the most of it!
Recently we found a problem that affected download speeds across the board, especially for customers with fast connections. This is the story of how we found and fixed the problem.
Warning: this post is about to get really detailed and nerdy. I’m sorry, I can’t help it. As a dev-ops guy, it’s my job to dive into the weeds.
How did we know that there was an issue in the first place? Diagnosing network transfer speeds can be very tricky because networks are immensely complicated. There are a million different places where things can go wrong, but they generally boil down to these, which nicely follows the path the data travels from us to a customer.
We ruled out customer problems because we heard from people with many different operating systems, configurations, and locations. Plus, I observed slow download speeds on my connection at home, and I have an awesome connection and computer. There’s no way it wasn’t up for the task.
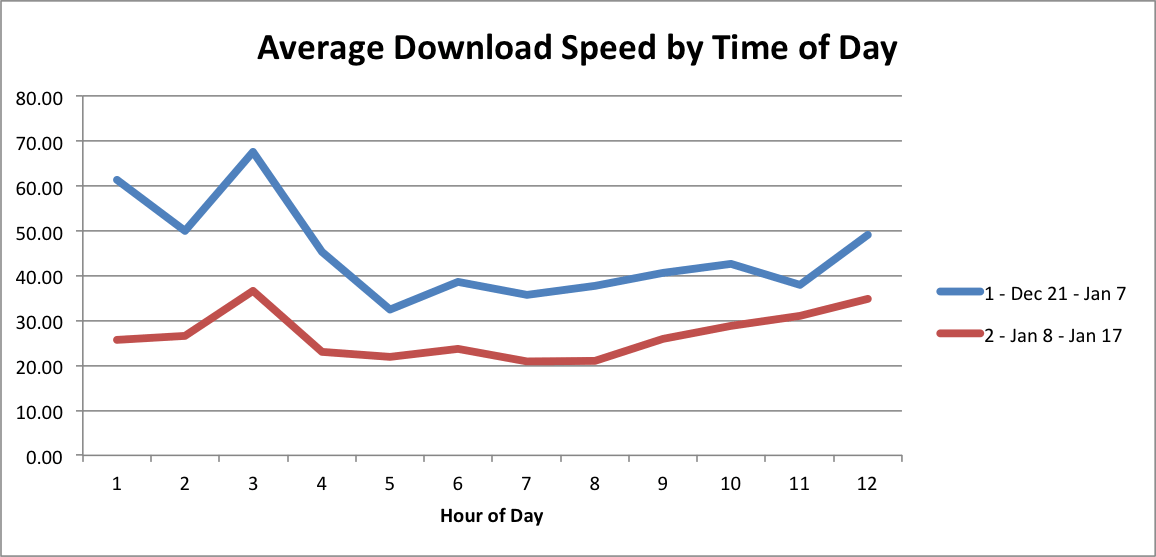
We have a php script that tests our upload and download speeds and it’s installed on virtual servers located around the world. The aggregated results from these tests showed that we clearly had a problem with our download speeds:
This graph shows two weeks’ worth of data, the blue line is Christmas week 2013 and the red line is the first week in January 2014, broken down by hour.

It shows us two things:
This indicated that we had an issue with traffic load. The more traffic on the network, the slower the download speed. Historically, Christmas is the week with the lowest traffic. It would only make sense that we’d see lower download speeds with increased connections if we were maxing out our outbound bandwidth, however, our firewall showed that we were far from max utilization.
If you want to see what’s actually happening when you transfer a file over the internet, you need to look at the packets that make up the traffic. Wireshark is an excellent tool for doing this. Looking at the traffic for a download from ExaVault, I noticed that we had many error packets that looked similar to this:
810417.387064000192.168.1.667.208.64.240TCP94[TCP Dup ACK 8020#42] 49213 > 61198 [ACK] Seq=1 Ack=6739718 Win=4194304 Len=0 TSval=981006868 TSecr=604385392 SLE=6764334 SRE=6806326 SLE=6755646 SRE=6762886 SLE=6741166 SRE=6754198
The “TCP Dup ACK” means that somewhere along the way, one of the packets didn’t arrive at the destination, which caused the other packets to be received out of order. When this happens, the network algorithm assumes that it’s due to network congestion, and throttles the connection’s speed down.

Check out the speed graph of a solid connection on the left, and a download from ExaVault on the right. I used a great network monitoring tool called Rubbernet to produce this graph.
Note how the download on the left reaches a stable point, maxing out the available bandwidth on my connection. The download on the right speed varies drastically. During this test, thousands of TCP Dup ACK packets were received.
At this point, I knew we were dropping TCP packets somewhere along the network path from our application server to the connecting client. I ran sftp to copy data to my computer from each point in the network traveling outward. I found that downloading files from the firewall was much faster than the storage box and I didn’t see the TCP Dup Ack packets during the download.
The firewall connects directly to the outbound link provided by our ISP, while our storage node connects to the firewall via a switch. The culprit had to be either our storage box or our switch. Transfers from one storage node to another storage node were fast, therefore, there had to be something wrong with the way the switch was communicating with the firewall.
Port 3 on the switch connects to the firewall, and the ifOutDiscards counter showed how many packets were dropped. For some reason, the switch itself was the cause of dropped packets.
# walkmib ifOutDiscardsifOutDiscards.1 = 0ifOutDiscards.2 = 12ifOutDiscards.3 = 5,277,709 ← firewall portifOutDiscards.4 = 0ifOutDiscards.5 = 0...
After extensive Googling, I found a post from someone who had a similar issue who said the problems were caused by the lack of per-port buffer memory on their switch. Enabling flow control on both ends of the connection fixed their issue.

I configured our switch to enable flow control on the firewall port and retested — this time I was able to pull data down at the same rate across every box on our network.
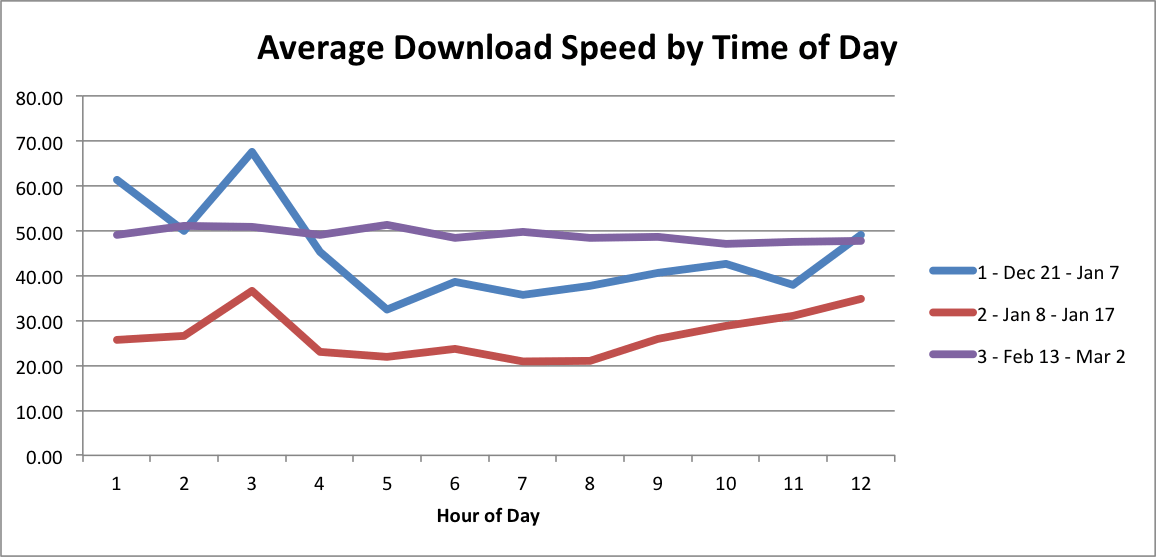
Later, we confirmed from our speed testing boxes that speed was consistent across all hours, shown as the purple line in the graph below.
After making these changes, our testing servers saw a 1.5x to 2.0x increase in download speeds. Quite a marked improvement! We fixed this issue back in February, so if you’re an ExaVault customer hopefully you’re enjoying the speed boost.
Troubleshooting network issues can be a huge pain and take a really long time to figure out. Although the path to fixing our issue might seem pretty straightforward after the fact, the steps we took to fix this problem were done over the course of a few months. For anyone else who might face a similar problem, here’s my advice:
Check out our support page for troubleshooting tips.

Want to create your own automation scripts for file transfer? With a few tips, you can get better automatin with an FTP client like WinSCP Read More

Set up receive folders, customize upload forms, and integrate into your website. Read More