Webhooks Logs

If you are an Admin user with an active webhook for your account, you can use the webhook logs to monitor activity. Webhooks logs include a record of every webhook attempt that our system has made and information on the success or failure of that call. Webhooks can be configured in the developer settings.
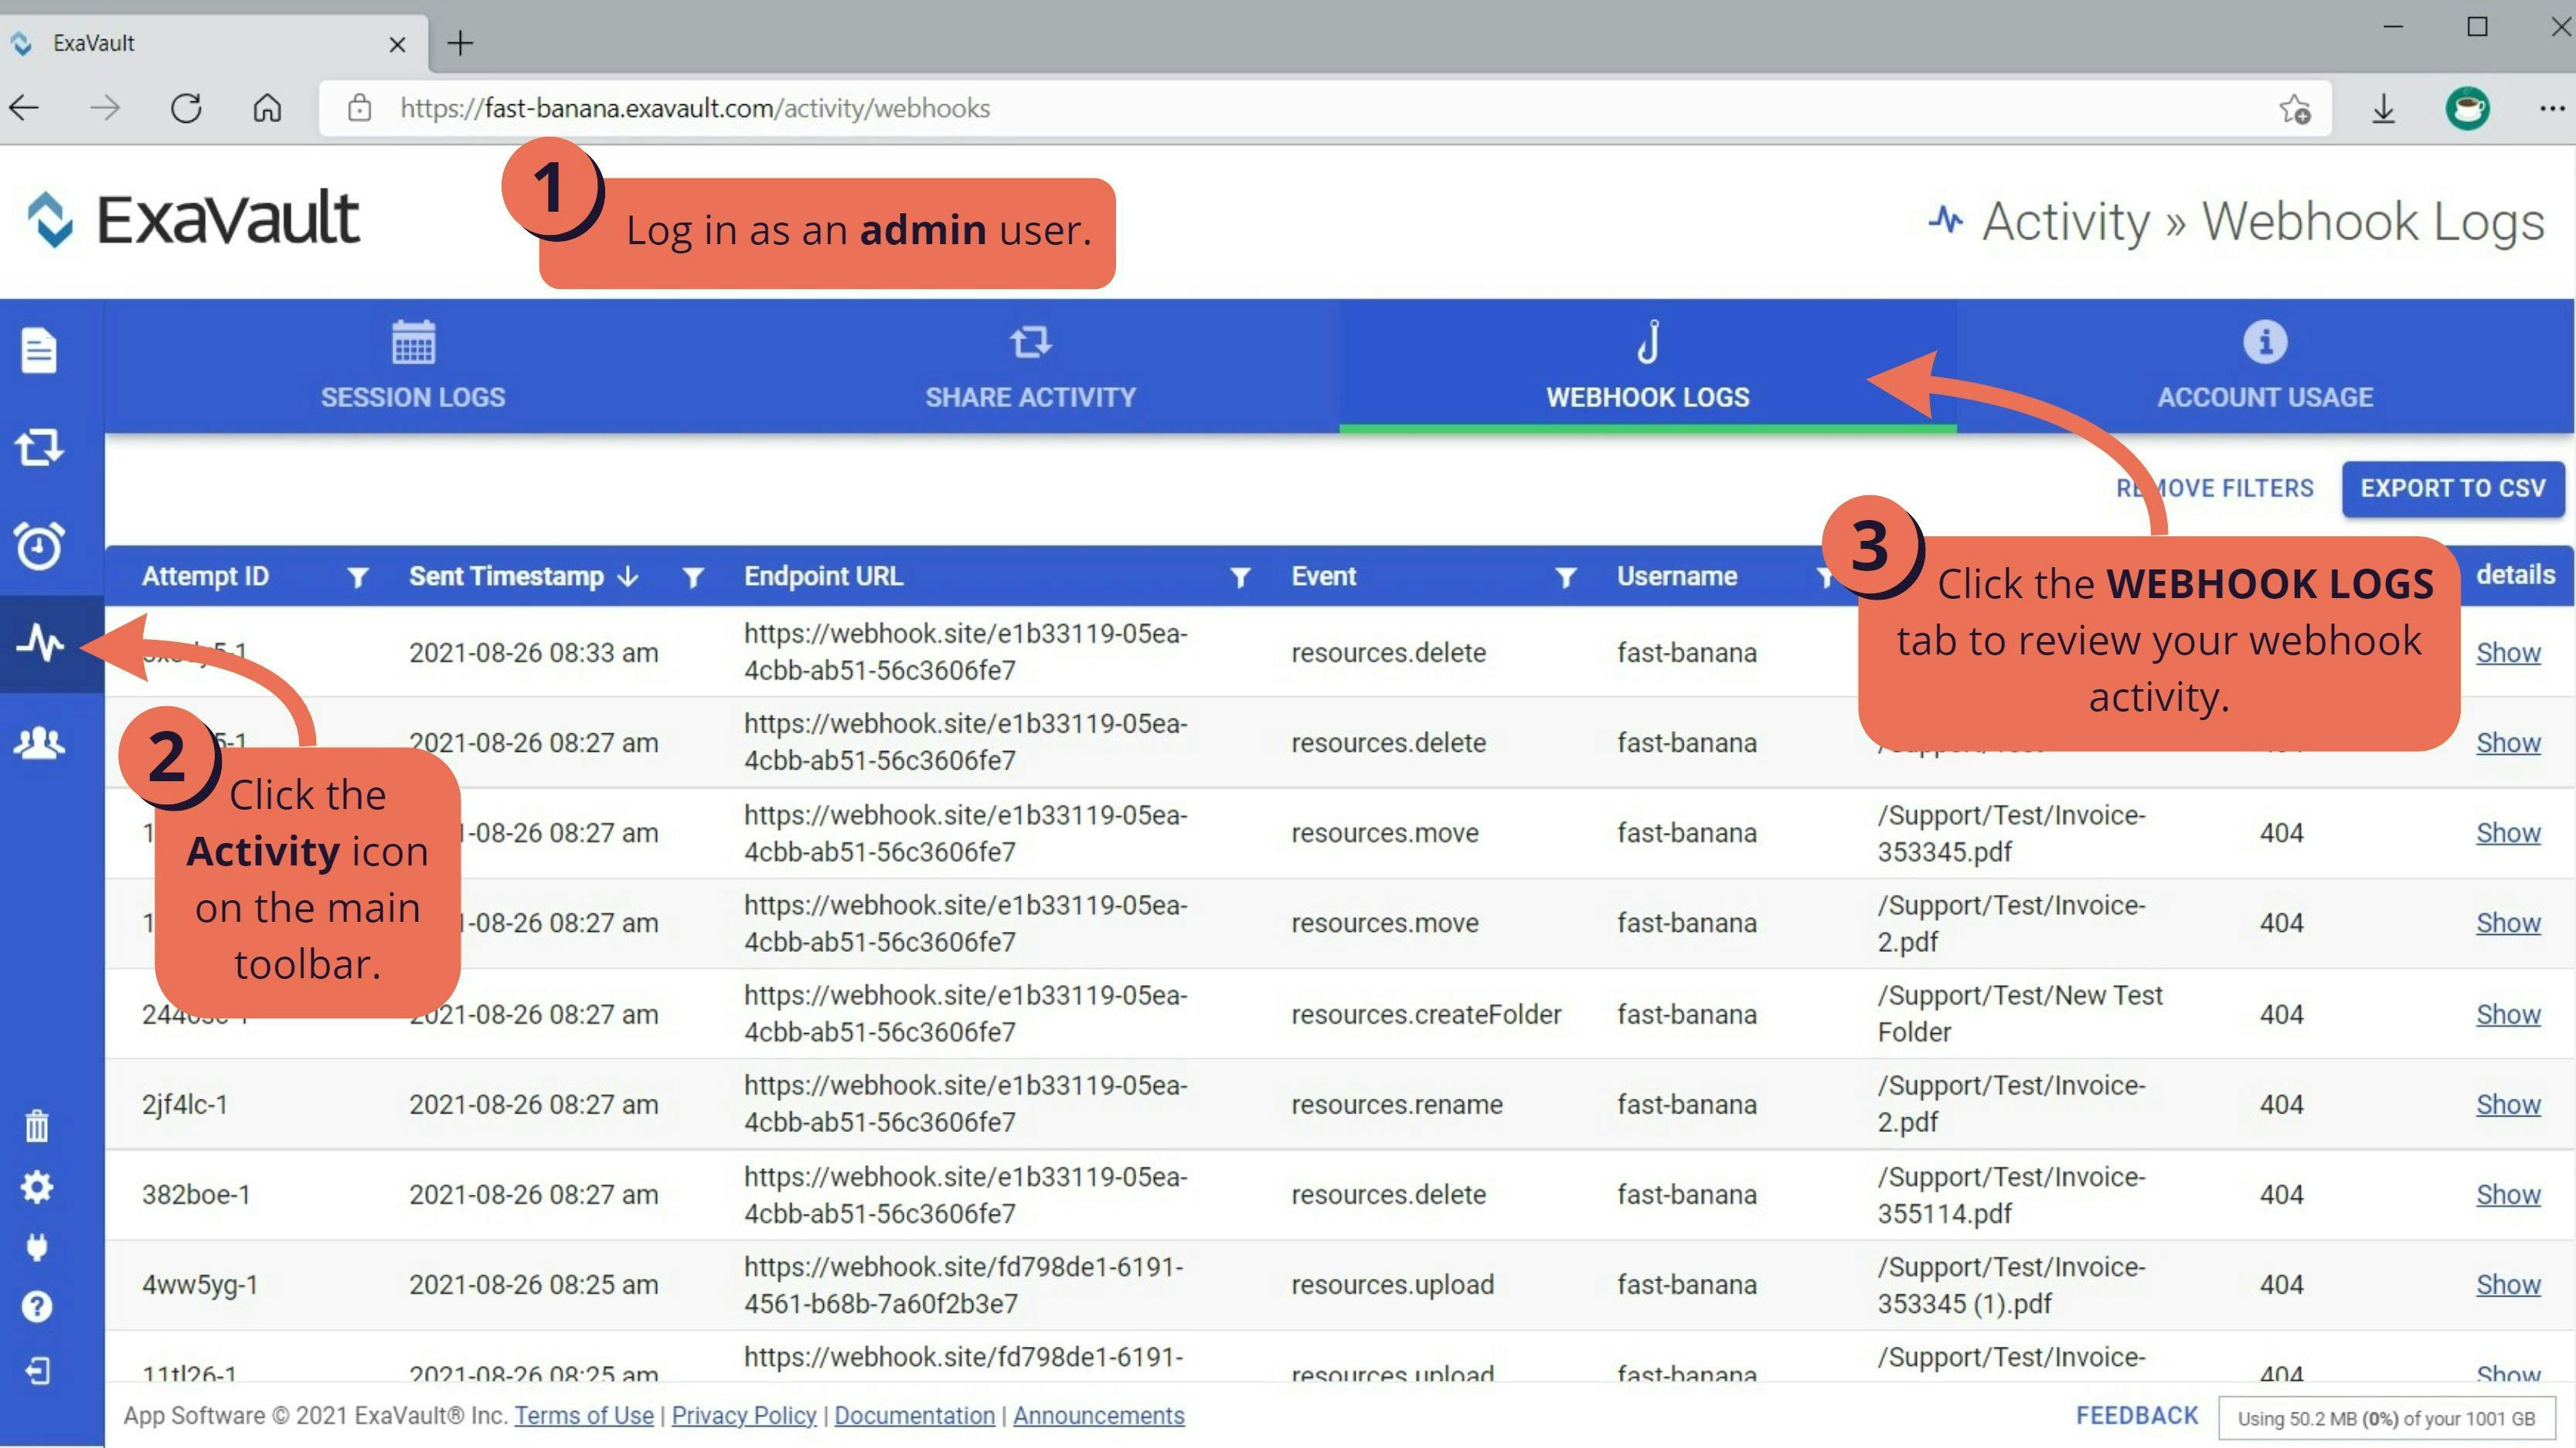
To access your webhooks logs:
1. Log in as an admin user.
2. Click the Activity button on the main toolbar.
3. Click on the WEBHOOK LOGS tab.
Column Data
- Attempt ID: Includes a unique ID and the attempt number for the webhook event.
- If you have a webhook that is failing, ExaVault will attempt this trigger up to 8 times before it is removed from the queue.
- Each attempt is noted by the “-#” suffix in the ID.
- For example: 4svn42-1 (first attempt), 4svn42-2 (second attempt), … 4svn42-8 (final attempt)
- Multiple attempts may happen if there is server interruption. If a webhook is not successful after 8 attempts, it is likely that the endpoint is misconfigured. - Sent Timestamp: The time the webhooks message was sent from the ExaVault server.
- Endpoint URL: Where the message was set. This address should be the same as the configured endpoint.
- Event: The action on the account that triggered the webhook attempt.
- Username: The user who performed the event that triggered the webhook attempt.
- Path/File: The location on the account where the event occurred.
- Status: The HTTP success or failure status code sent for the attempt.
- Details: Click the Show button to:
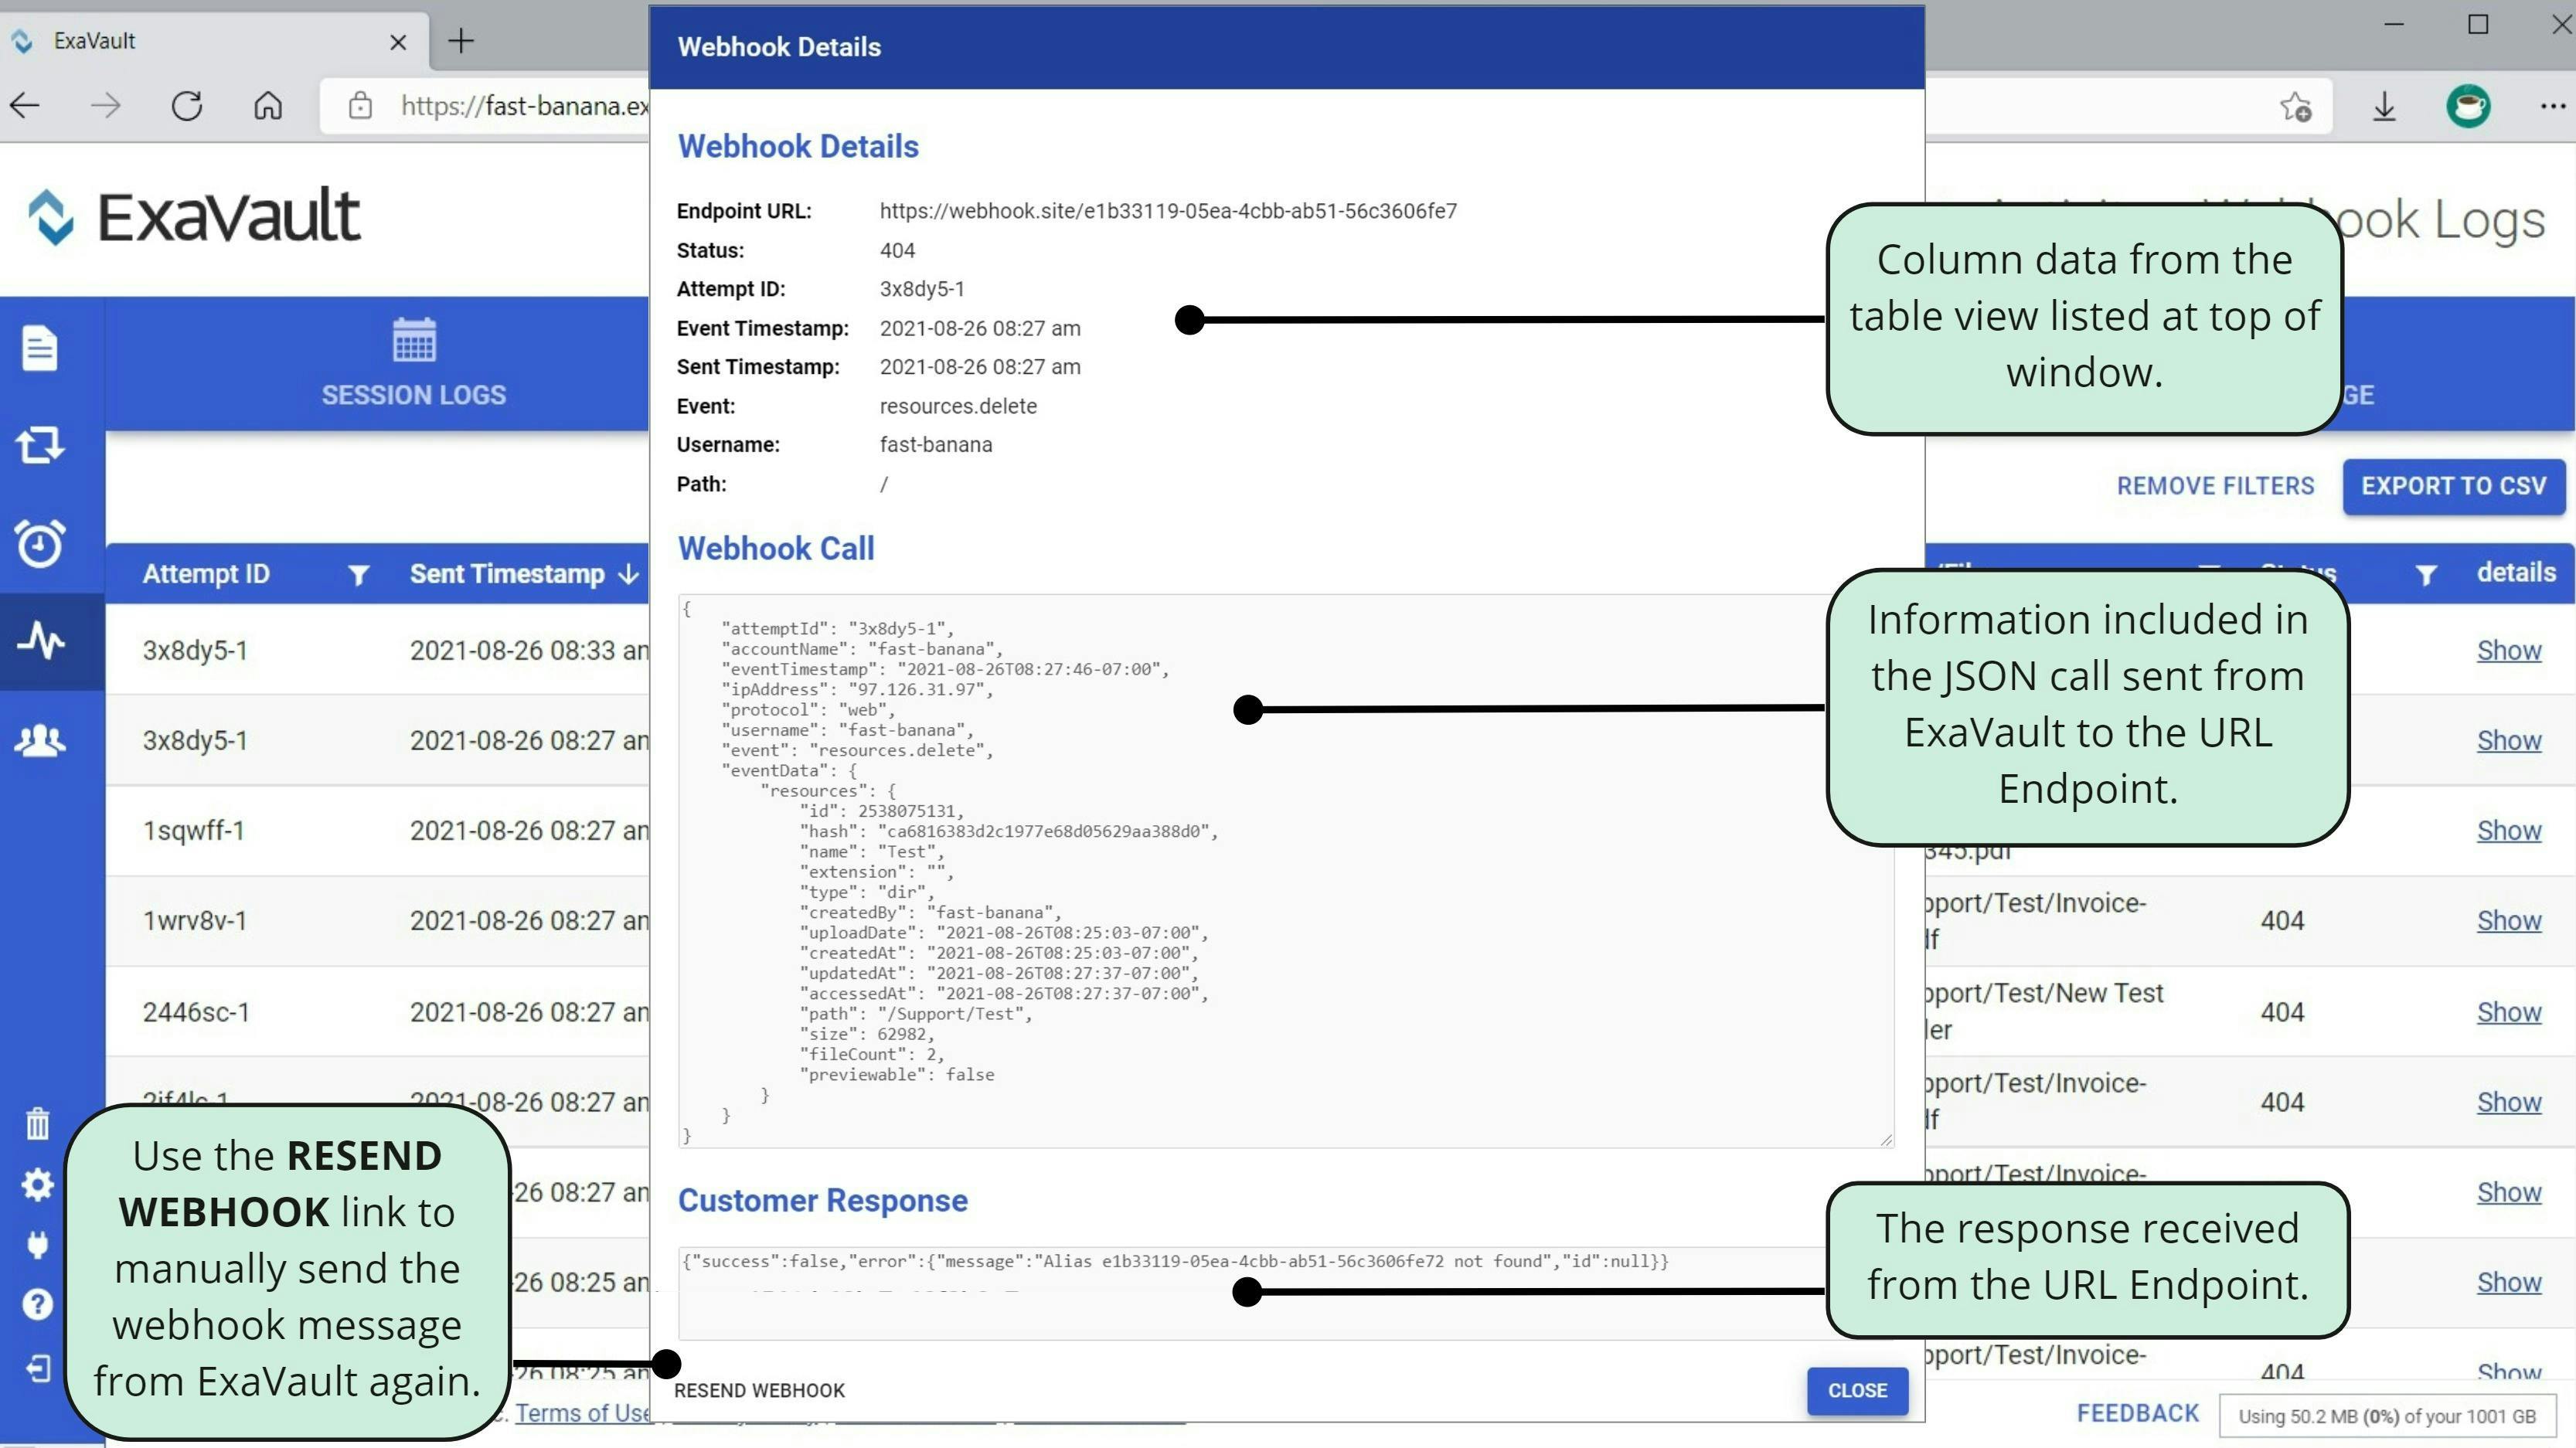
- View the contents of the webhook call originally sent by ExaVault to the destination endpoint.
- View the contents of the customer response message that was sent by the endpoint back to the ExaVault server.
- Click the RESEND WEBHOOK link to manually send the webhook message from ExaVault again.
Managing the Webhook Log
If you have a lot of activity in your account, your webhooks log can become very large and unwieldy. Sort and filter options help you find the specific calls you want to review.
Sorting
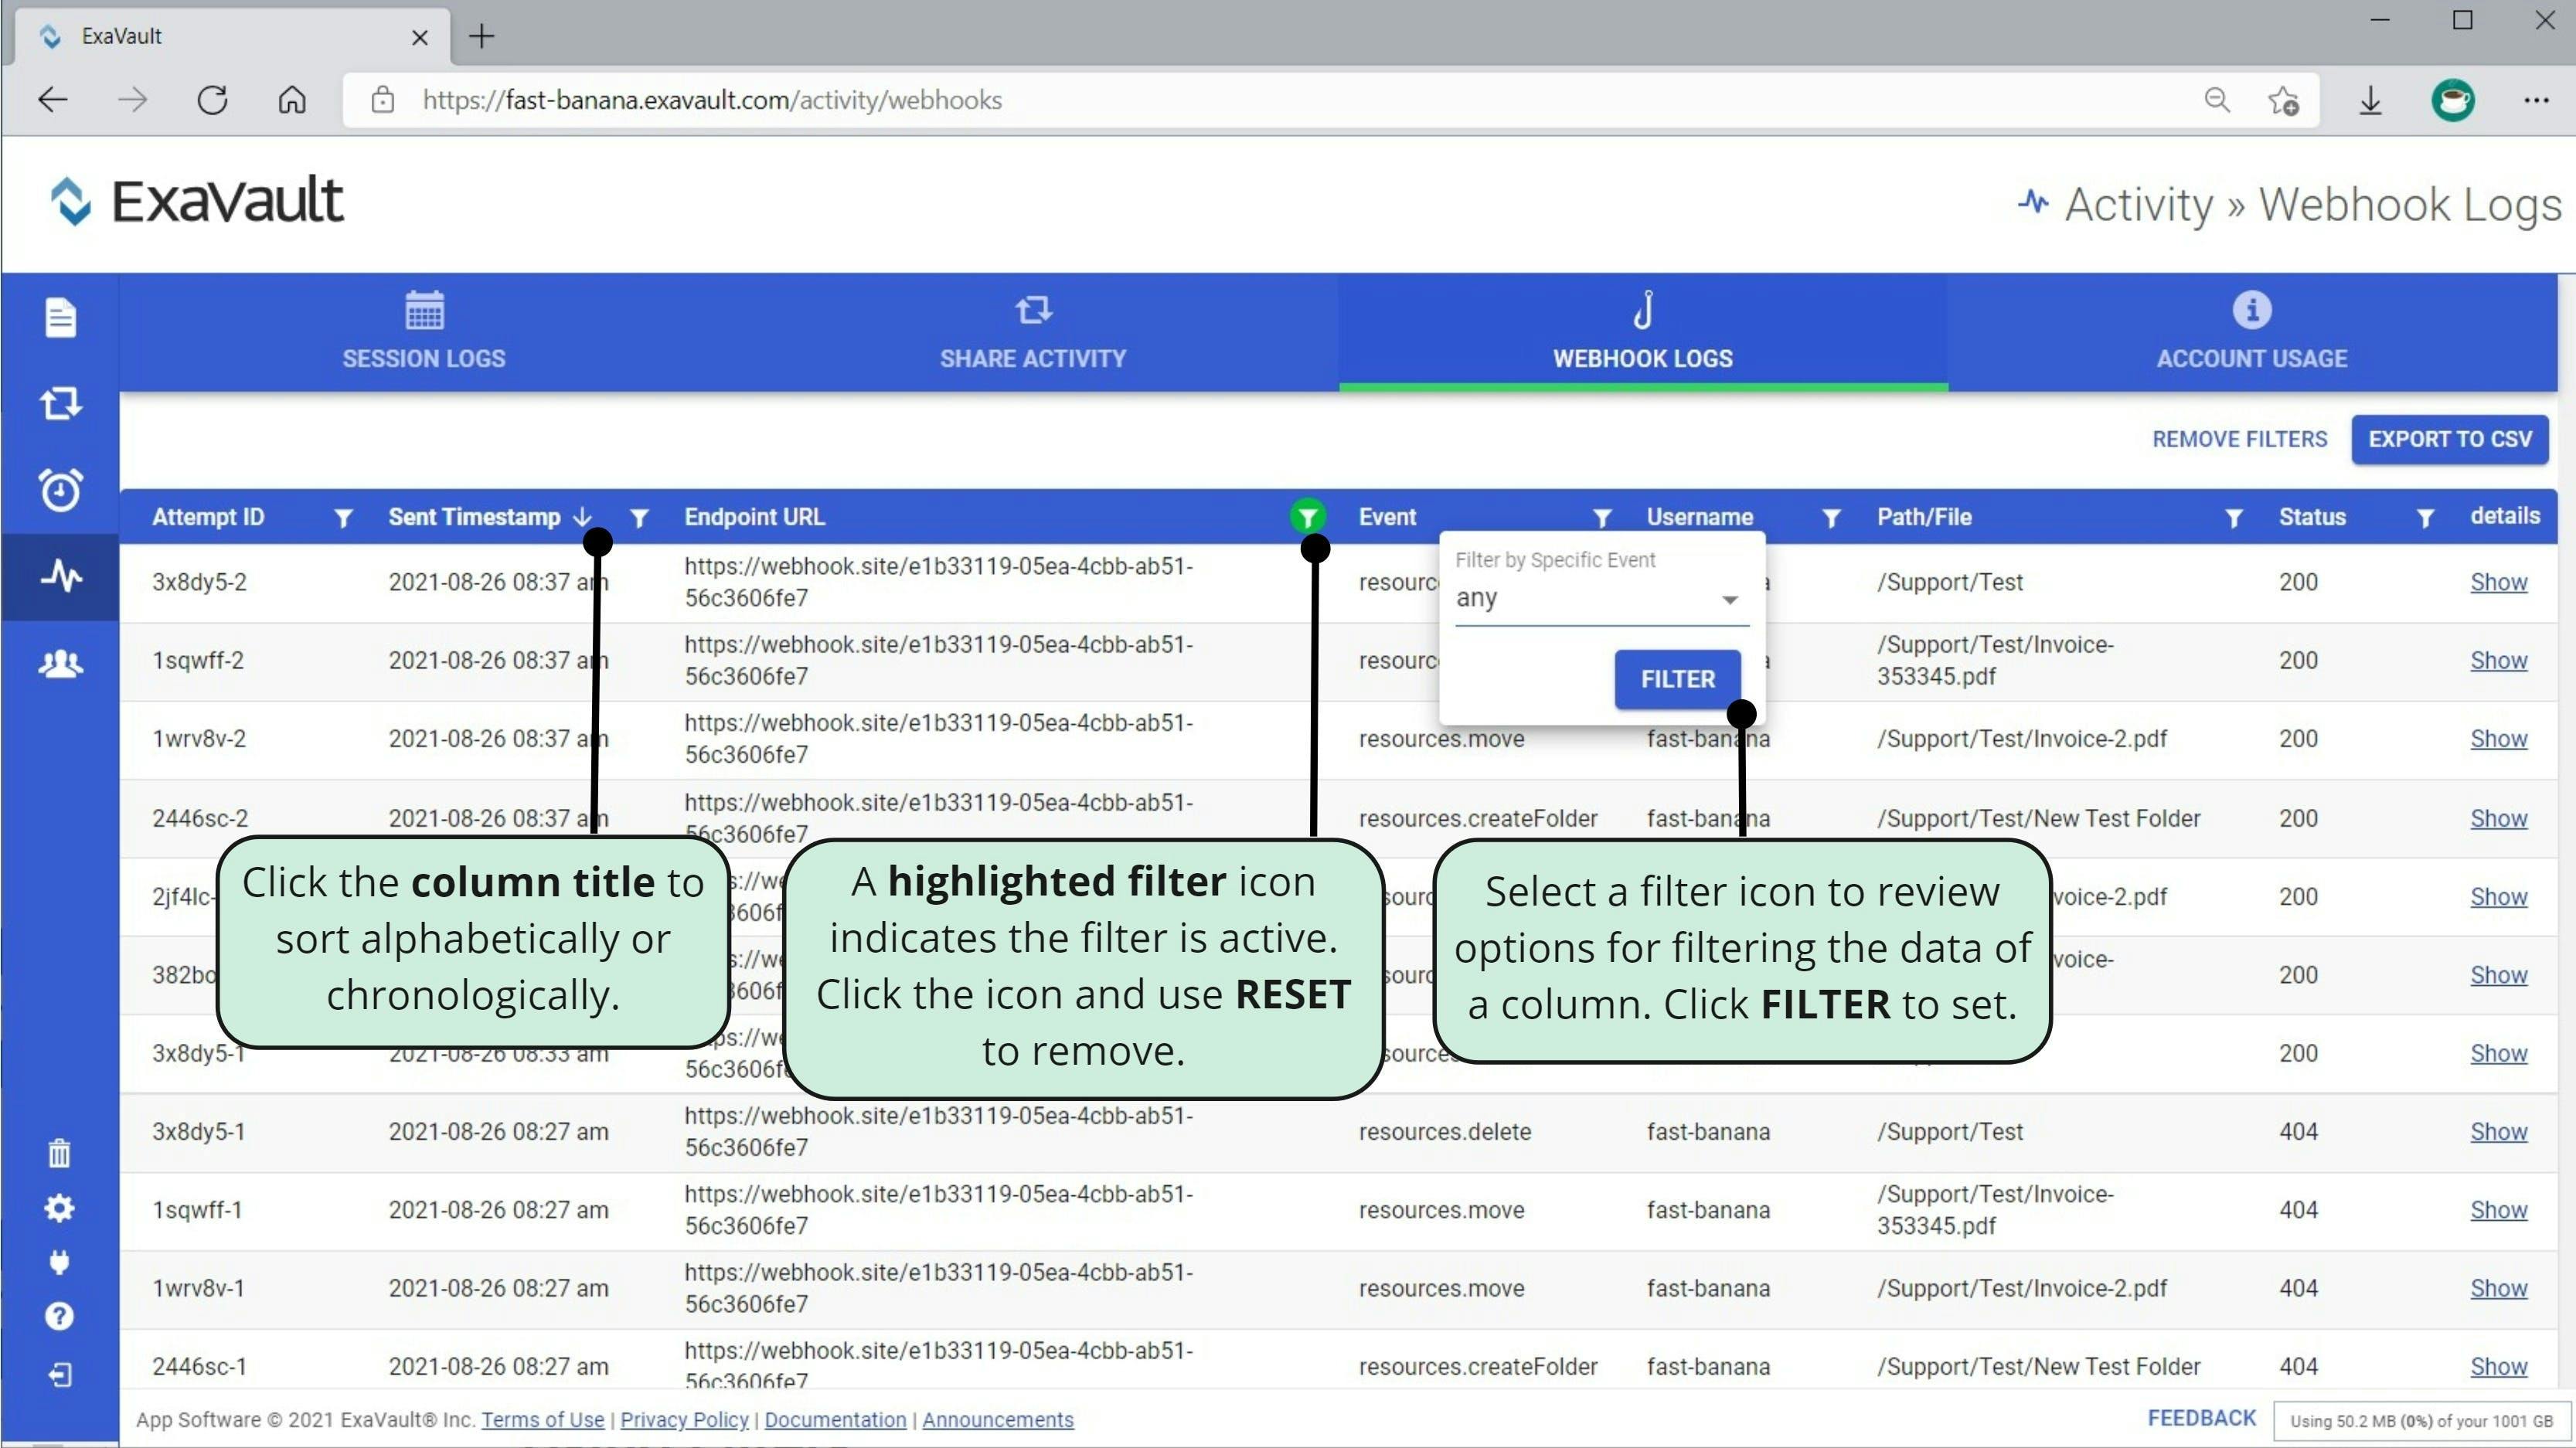
- If you click the column title, the table data will be sorted alphabetically based on the data of the column title you selected.
- If the up arrow (↑) is displayed when clicked, the data will be sorted A to Z
- If the down arrow (↓) is displayed when clicked, the data will be sorted Z to A
Using Filters
- To filter your log by a specific column:
1. Click the small filter icon to the right of the column title.
2. Provide the criteria requests.
3. Click FILTER. - The icon will be highlighted when the filter is applied.
- To remove a filter, click on a highlighted filter icon and then select RESET.
- You can apply as many filters as you like.
Filter Types
- Filter by text
- Use the text field to type a search criteria for the column you select.
- Partial text matches are allowed.
- For example: searching for a Path/File “.jpg” would return any file with the .jpg extension from your webhooks log.
- Can be applied to Attempt ID, URL Endpoint, Username, Path/File, and Status. - Filter by Date Range (Sent Timestamp): Use this filter to see all webhook attempts that happened between a specific start and end date.
- Filter by Specific Event (Event): Select a specific event from the dropdown to display only those results.
Export to CSV Button
- Use this button to export a copy of the data in your webhooks log.
- Any filters applied will also be applied to the data export.
For more details on using webhooks, please see the webhooks developer documentation.
Table Of Contents
Support Library
Still Have Questions?
Email Us
Don't see the answer you need? Drop us a note, and our support team will email you back.
Send Email


